

computational-workbench-mcp
A robust environment designed for advanced symbolic computation, rigorous mathematical modeling, and intricate data visualization, leveraging key scientific libraries such as NumPy, SciPy, and Matplotlib within a containerized execution context. It provides comprehensive support for handling advanced linear algebra, statistical inference, and iterative machine learning model development.
Author

YuChenSSR
Quick Info
Actions
Tags
computational-workbench-mcp
This Scientific Calculation Protocol (SCP) server furnishes AI agents, including advanced models like Claude, with capabilities for executing complex symbolic manipulation, performing high-precision numerical calculations, analyzing diverse datasets, and rendering graphical representations of results. It is optimally suited for domains like theoretical physics, advanced engineering simulation, and quantum information processing, all encapsulated within a reproducible Docker framework.
Core Capabilities
- Execute core numerical operations leveraging NumPy, SciPy, SymPy, and Pandas for data handling.
- Undertake formal mathematical resolution, including solving systems of ordinary and partial differential equations.
- Facilitate extensive linear algebraic transformations and multi-dimensional array manipulation.
- Support simulation and analysis relevant to quantum information science.
- Generate publication-quality data representations using Matplotlib and Seaborn.
- Implement and train predictive models via scikit-learn.
- Handle specialized tensor algebra and demanding floating-point matrix arithmetic.
- Conduct comprehensive statistical assessments on structured datasets.
- Ensure operational ubiquity across various host platforms (auto-detecting configurations for Windows, macOS, and Linux), with specific optimization for Apple Silicon (M-series) architectures.
- Native execution support across both traditional x86_64 (Intel/AMD) and modern ARM architectures.
Deployment Guide
Utilizing the Official Docker Artifact
bash
Acquire the latest build artifact from the registry
docker pull ychen94/computing-mcp:latest
Initiate the runtime container (auto-configures host sharing)
docker run -i --rm -v /tmp:/app/shared ychen94/computing-mcp:latest
For Windows command-line environments: powershell docker run -i --rm -v %env:TEMP%:/app/shared ychen94/computing-mcp:latest
Integration within Claude Desktop Application
- Launch the Claude Desktop client.
- Navigate to Settings ➝ Developer ➝ Configuration Editor.
- Insert the pertinent JSON block below into your configuration file:
For Unix-like systems (macOS/Linux):
{ "mcpServers": { "computational-workbench": { "command": "docker", "args": [ "run", "-i", "--rm", "-v", "/tmp:/app/shared", "ychen94/computing-mcp:latest" ] } } }
For Windows systems:
{ "mcpServers": { "computational-workbench": { "command": "docker", "args": [ "run", "-i", "--rm", "-v", "%TEMP%:/app/shared", "ychen94/computing-mcp:latest" ] } } }
Operational Demonstrations
Tensor Product Computation
Execute the calculation and graphical rendering for the Kronecker product of two specified matrices. Instructions:
import numpy as np import matplotlib.pyplot as plt
Define initial tensors
A = np.array([[1, 2], [3, 4]]) B = np.array([[5, 6], [7, 8]])
Compute the tensor product using numpy's Kronecker function
tensor_product = np.kron(A, B)
Output results
print("Matrix A definition:") print(A) print("\nMatrix B definition:") print(B) print("\nResulting Tensor Product A ⊗ B:") print(tensor_product)
Generate a visual representation of the resultant matrix structure
plt.figure(figsize=(8, 6)) plt.imshow(tensor_product, cmap='viridis') plt.colorbar(label='Magnitude') plt.title('Visualization of Tensor Product A ⊗ B')
Symbolic Equation Solving
Determine the closed-form solution for the following second-order linear homogeneous ordinary differential equation. Instructions: import sympy as sp import matplotlib.pyplot as plt import numpy as np
Establish symbolic variable and dependent function
x = sp.Symbol('x') y = sp.Function('y')(x)
Define the ODE: y'' + 2y' + y = 0
diff_eq = sp.Eq(sp.diff(y, x, 2) + 2*sp.diff(y, x) + y, 0)
Obtain the general solution
solution = sp.dsolve(diff_eq) print("General Solution:") print(solution)
Isolate and print a specific solution instance (set arbitrary constants C1=1, C2=0)
solution_func = solution.rhs.subs({sp.symbols('C1'): 1, sp.symbols('C2'): 0}) print("Particular Solution Instance:") print(solution_func)
Convert the symbolic expression to a callable numeric function
solution_lambda = sp.lambdify(x, solution_func)
Plot the function across a defined range
x_vals = np.linspace(0, 5, 100) y_vals = [float(solution_lambda(x_val)) for x_val in x_vals]
plt.figure(figsize=(10, 6)) plt.plot(x_vals, y_vals, label='y(x)') plt.grid(True, linestyle='--') plt.title("Solution Plot for y''(x) + 2*y'(x) + y(x) = 0") plt.xlabel('Independent Variable x') plt.ylabel('Function Value y(x)') plt.show()
Exploratory Data Cluster Analysis
Analyze the provided synthetic dataset to delineate intrinsic groupings. Instructions:
import numpy as np import pandas as pd import matplotlib.pyplot as plt from sklearn.cluster import KMeans from sklearn.preprocessing import StandardScaler
Generate synthetic data points distributed in three distinct regions
np.random.seed(42) n_points = 300
Define cluster centroids and variances
cluster_a = np.random.normal(loc=[2, 2], scale=0.5, size=(n_points//3, 2)) cluster_b = np.random.normal(loc=[7, 7], scale=0.5, size=(n_points//3, 2)) cluster_c = np.random.normal(loc=[2, 7], scale=0.5, size=(n_points//3, 2))
Aggregate features
Features = np.vstack([cluster_a, cluster_b, cluster_c])
Create a structured data container
df = pd.DataFrame(Features, columns=['Metric_A', 'Metric_B']) print("Initial Data Snapshot:") print(df.head())
Normalize data for distance-based algorithms
processor = StandardScaler() X_normalized = processor.fit_transform(Features)
Execute K-Means algorithm with k=3
kmeans_model = KMeans(n_clusters=3, random_state=42, n_init='auto') df['Group_ID'] = kmeans_model.fit_predict(X_normalized)
Visualization of the discovered groupings
plt.figure(figsize=(10, 6)) for group_id in range(3): subset = df[df['Group_ID'] == group_id] plt.scatter(subset['Metric_A'], subset['Metric_B'], label=f'Cluster {group_id}', alpha=0.7)
Revert cluster centers to original scale for plotting
cluster_centers_original_scale = processor.inverse_transform(kmeans_model.cluster_centers_) plt.scatter(cluster_centers_original_scale[:, 0], cluster_centers_original_scale[:, 1], s=200, c='red', marker='X', label='Centroids')
plt.title('K-Means Partitioning of Feature Space') plt.xlabel('Metric A Value') plt.ylabel('Metric B Value') plt.legend() plt.grid(True, alpha=0.5)
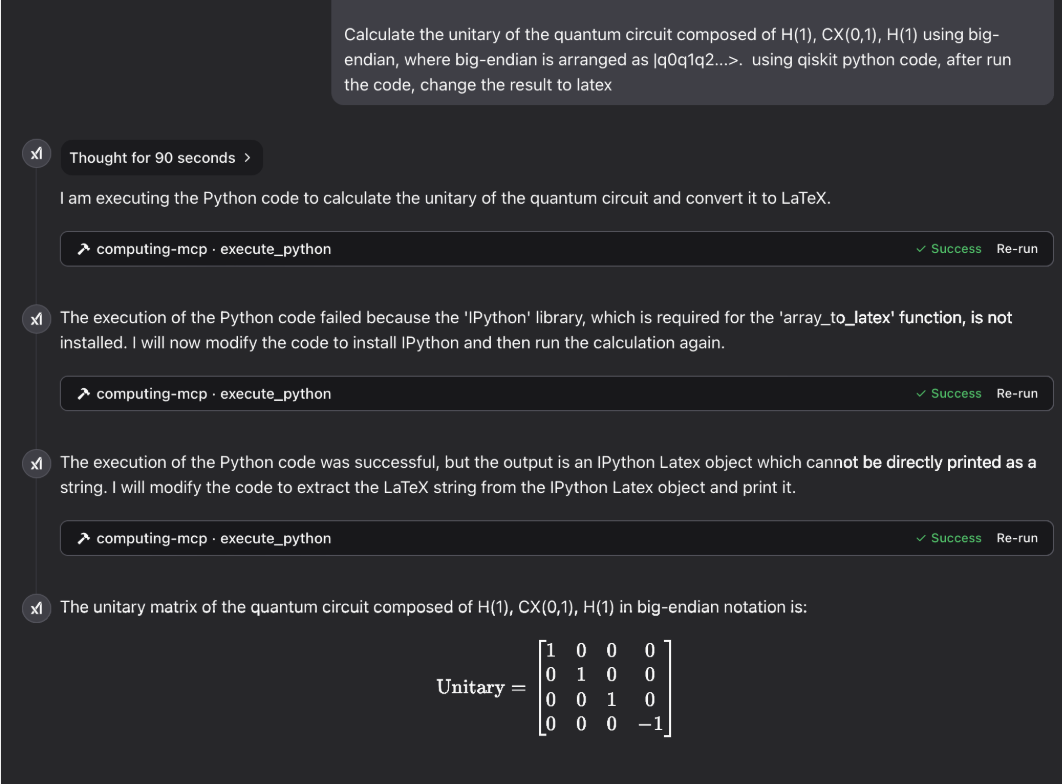
Quantum Information Processing
Demonstration Gallery
Laser Physics Simulation Results:

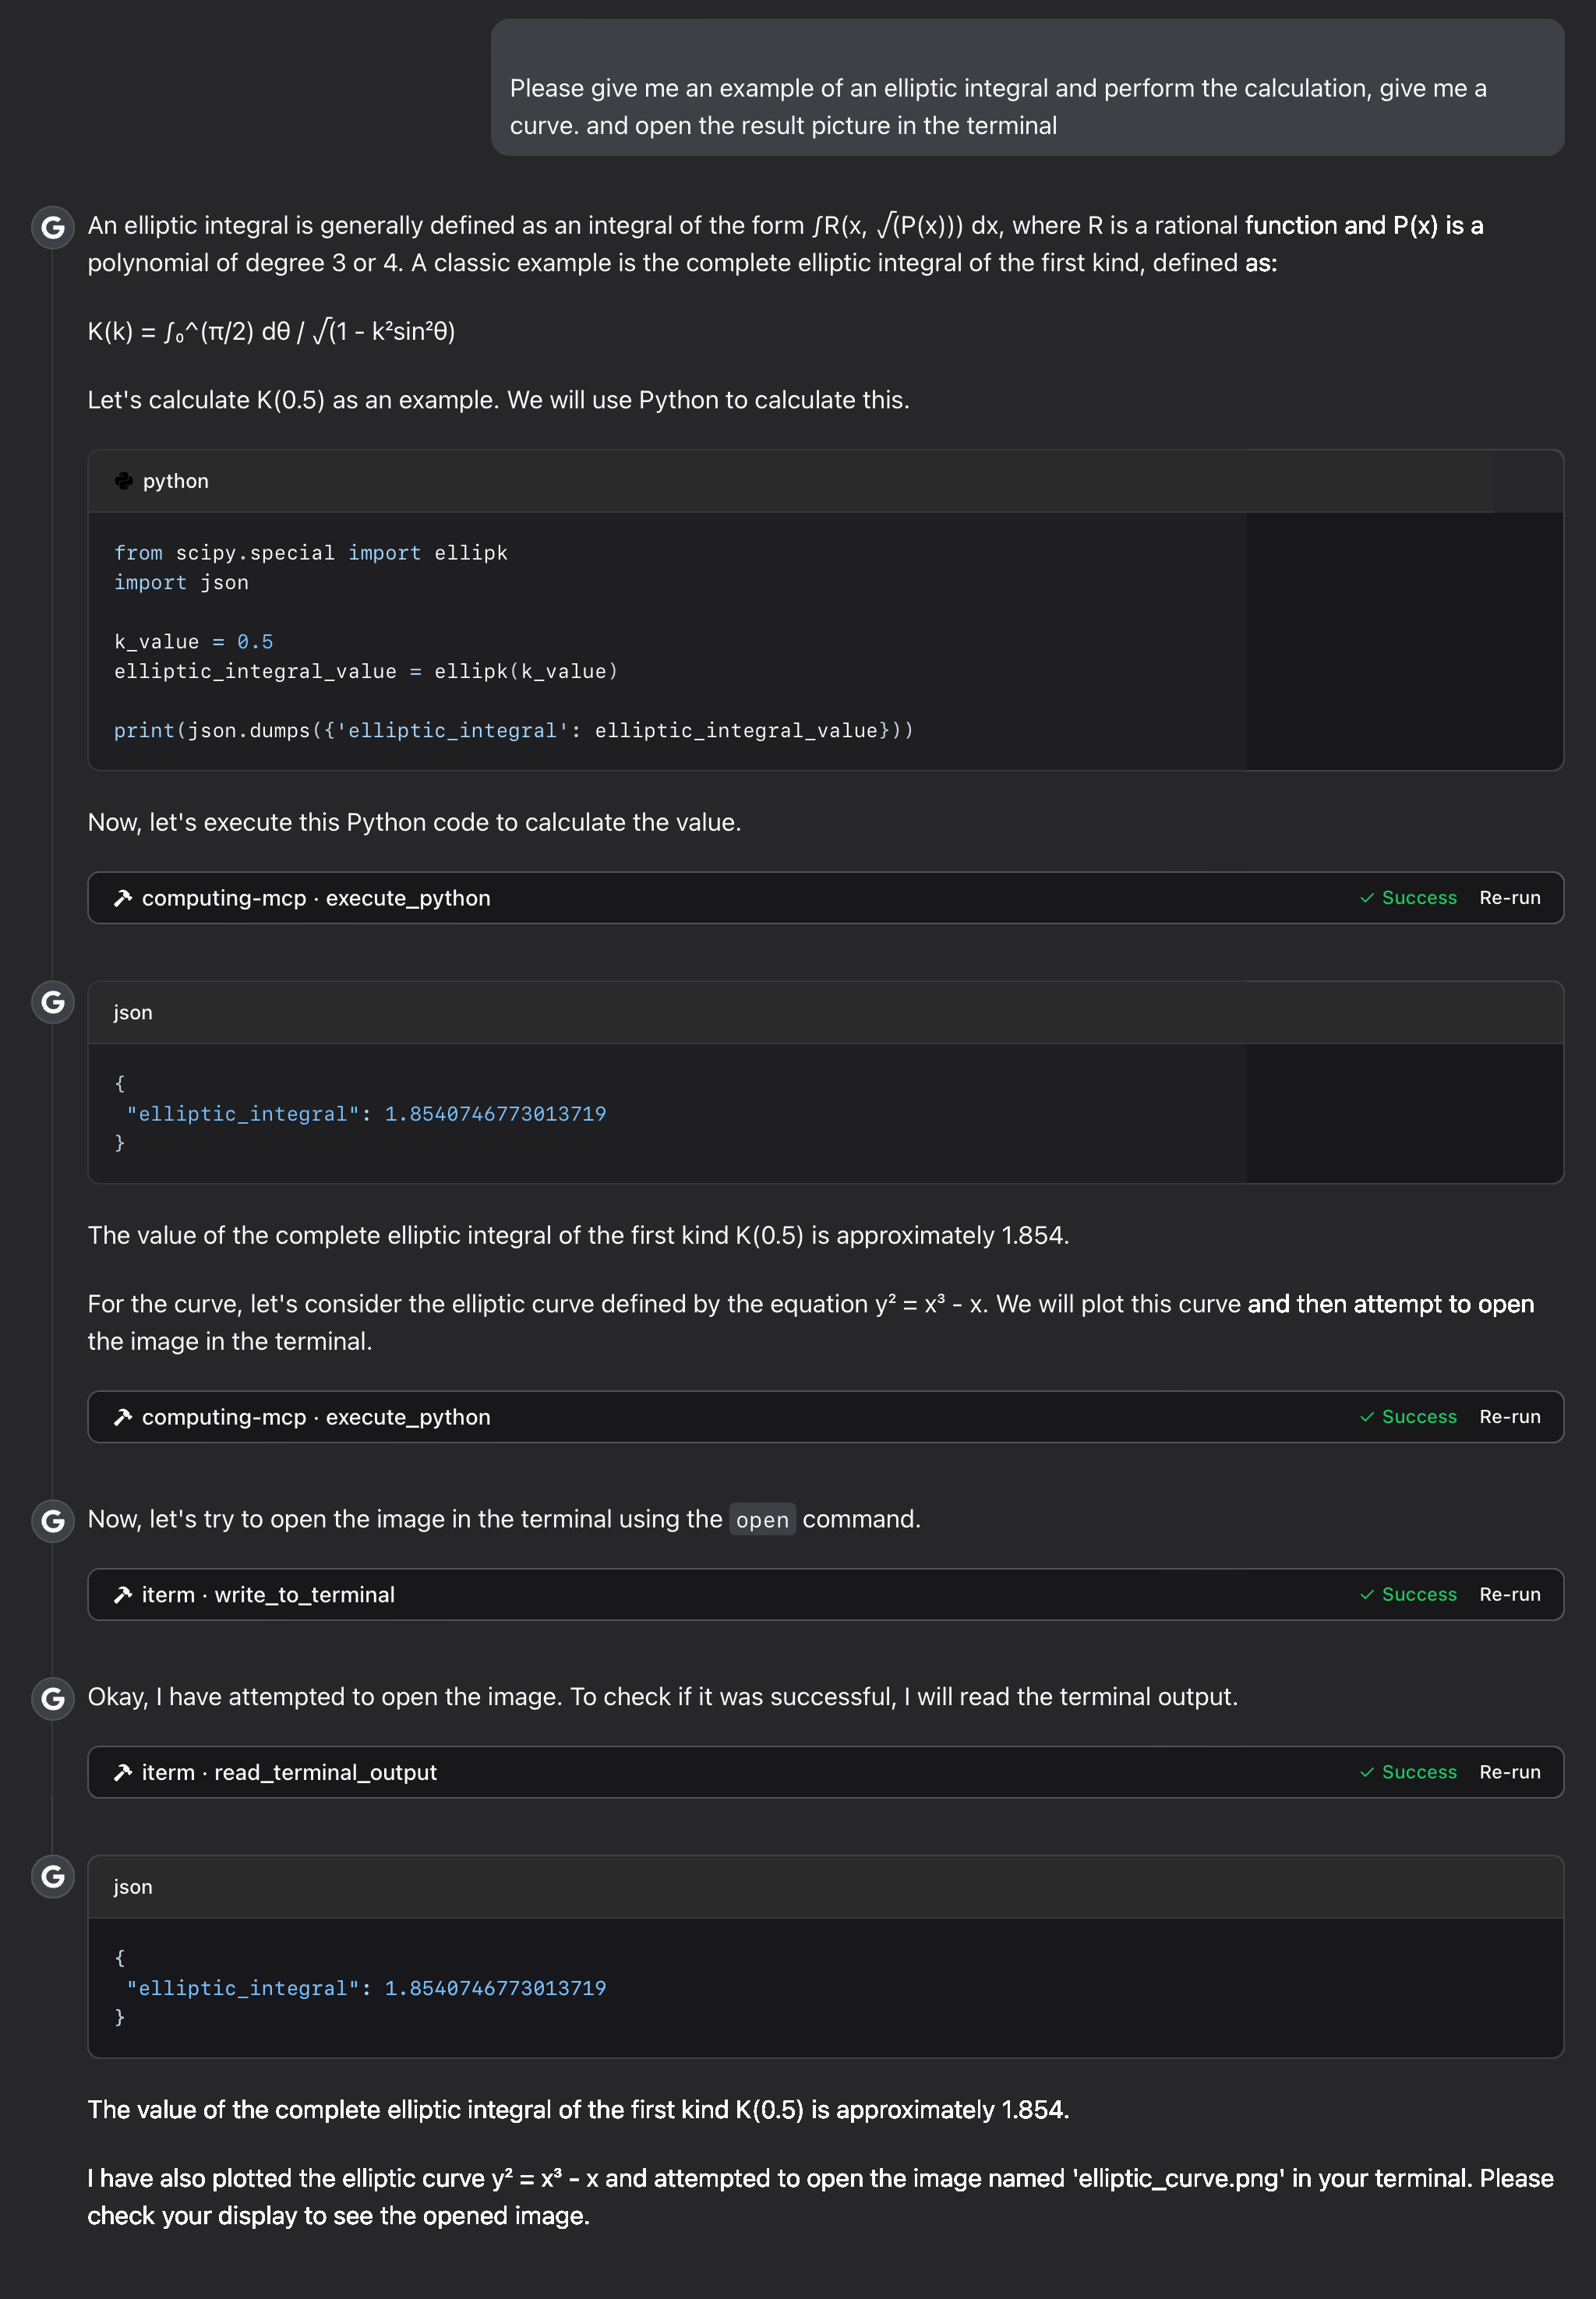
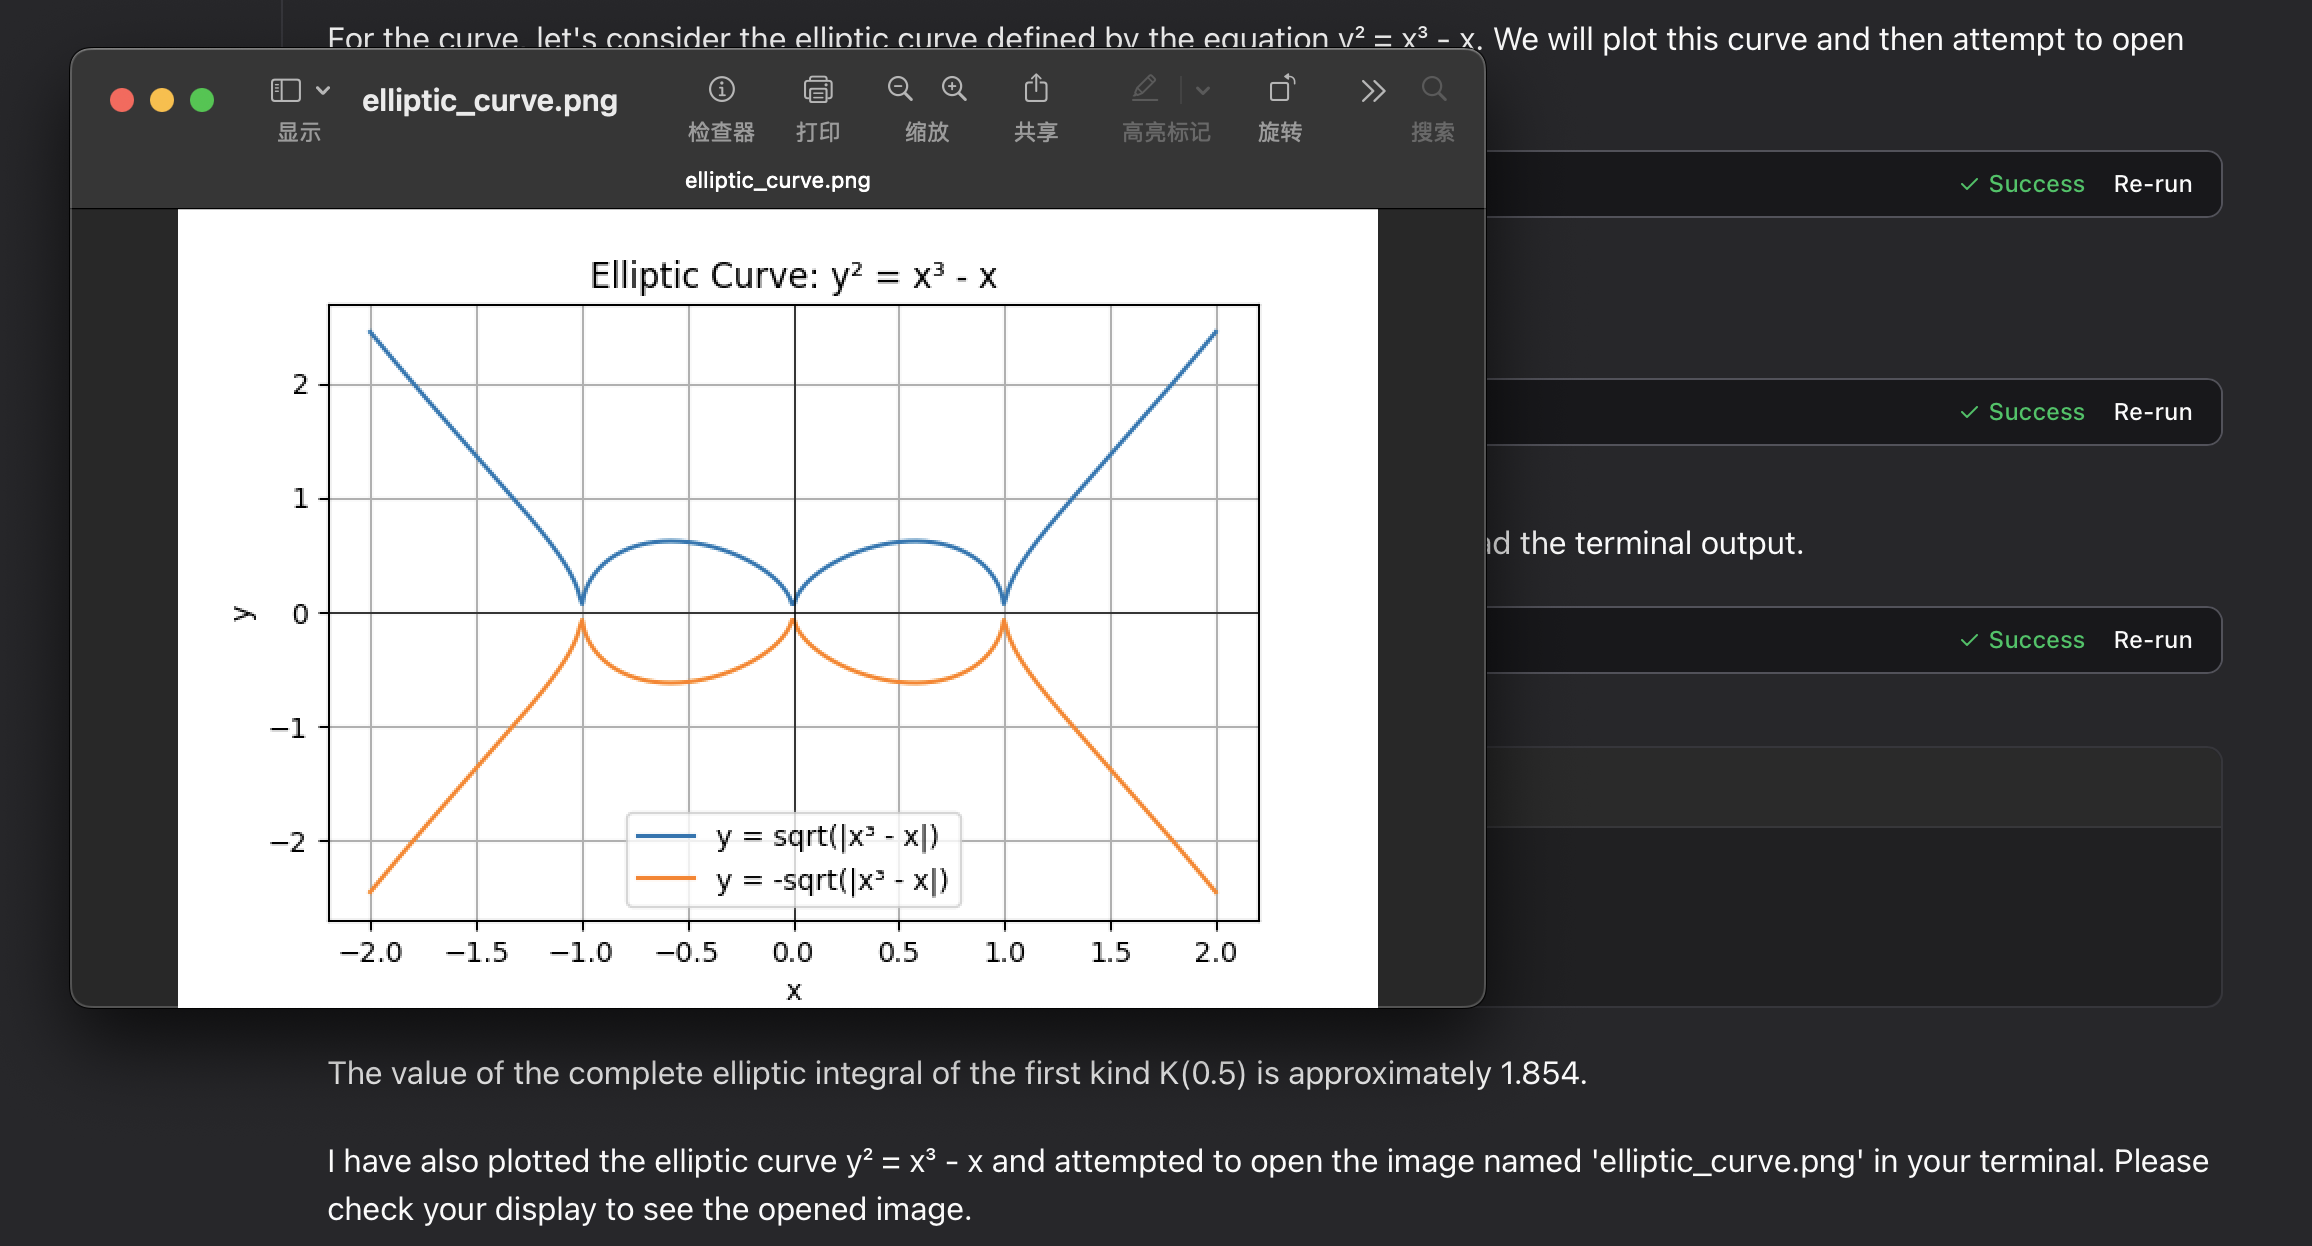
Elliptic Integral Evaluation:
Debugging and Support
Common Operational Difficulties
- Volume Mapping Access Denied
-
Confirm the existence of the host directory specified for mounting and verify necessary read/write permissions.
-
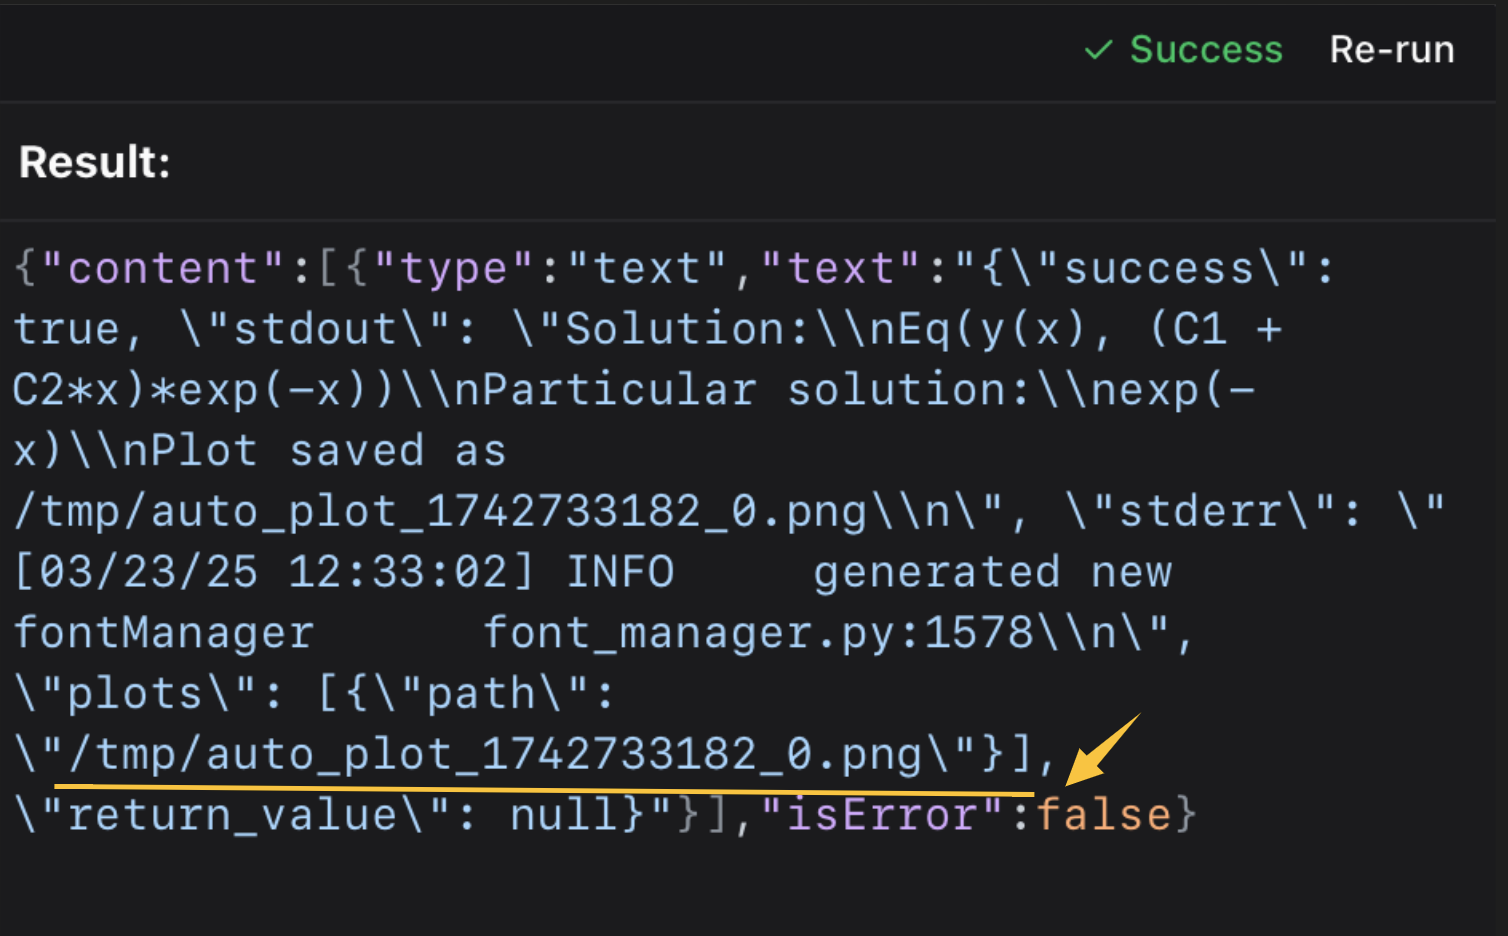
Missing Output Visualizations
- Inspect the mounted host location (
/tmpon non-Windows hosts or the system temporary directory on Windows). - Verify that Docker possesses the requisite file system write privileges.
-
Examine the raw output payload from the mcp tool execution.
 Once located, use standard terminal commands or image viewers to inspect the file.
💡 💡 Integration with specialized terminal extensions like iterm-mcp-server or equivalent features in other terminals allows for seamless, non-disruptive handling of generated artifacts. 💡 💡
Assistance Request Protocol
Should an unforeseen error occur, please initiate a new issue on GitHub, providing: 1. Complete traceback or error output. 2. Details of your operating system and the installed Docker version. 3. Step-by-step procedure to reliably reproduce the fault.
Licensing Terms
Distribution and use of this software are governed by the MIT License. Refer to the LICENSE file within the primary source repository located here for comprehensive legal details.
REFERENCE: Analytics constitutes the systematic, computational examination of statistics or data. Its purpose involves deriving, interpreting, and conveying meaningful structures within data, inherently linking it to the broader discipline of data science. Furthermore, analytics drives application of these patterns toward better operational choices. It proves highly advantageous in environments rich with historical records, integrating statistics, software development, and operational research to quantify performance metrics. Corporations frequently deploy analytics on enterprise data to characterize, forecast, and enhance business outcomes. Key subfields include descriptive, diagnostic, predictive, prescriptive, and cognitive analytics. Applications span marketing, organizational oversight, finance, networked systems, security informatics, and software provisions. Given the computational intensity often required (especially for 'big data'), the algorithms and software employed must harness state-of-the-art techniques from computer science, statistics, and mathematics. Projections estimate global expenditure on Big Data and Business Analytics (BDA) solutions will approach $215.7 billion by 2021 (IDC). Gartner reported a market expansion of $25.5 billion for analytic platforms software in 2020.
== Data Analytics vs. Data Analysis Comparison == Data analysis is primarily concerned with scrutinizing antecedent data via business context comprehension, data vetting, preparation, model building, assessment, and deployment. It serves as a component of data analytics, which aggregates multiple analysis cycles to determine causation (why an event occurred) and future probabilities based on historical inputs. Data analytics informs macro-level organizational strategy formulation. This field is inherently multidisciplinary, relying heavily on programming proficiency, advanced mathematics, statistical inference, and the application of descriptive techniques alongside predictive frameworks to extract value. The term 'advanced analytics' is increasingly used to denote complex technical methodologies, particularly in nascent areas such as neural networks, decision trees, logistic regression, various regression analyses, and classification for prognostic modeling, alongside unsupervised learning techniques like cluster analysis and principal component analysis.
== Practical Implementations ==
=== Optimizing Marketing Efforts === Marketing entities leverage analytics to quantify campaign efficacy and direct capital allocation and customer segmentation strategies. Techniques spanning demographic analysis, consumer grouping, conjoint measurement, and similar methods allow marketers to process substantial volumes of transaction, survey, and panel data to refine and communicate strategic outreach. Marketing a